The MACD Trading Indicator
If you want to start day trading, whether we are talking about stocks, Forex, cryptocurrencies or anything in between, it is extremely important that you know how to perform technical analysis. Now. With that being said, there are many different technical analysis tools or indicators out there. Of course, knowing all about indicators is extremely important. With that being said, one of the most important technical analysis indicators out there at this time is the MACD indicator.
In terms of accurate and useful technical analysis indicators that MACD or moving average convergence, divergent indicator is definitely one of the best out there, it has the ability to provide you with a variety of information in relation to the trend of a price of a security. At this time it is one of the most widely used technical analysis indicators out there.
Now, if you have no idea what this MACD indicator is, don’t worry too much because this is exactly what we are here to explain. Today we’re going to explain to you what exactly this indicator is, how it works, what it tells you, how to calculate it, and more. Let’s get right to it and figure out exactly how to trade with this MACCD indicator so you can start making consistent profits on a daily basis.
What is the MACD Trading Indicator?
The first thing that you need to know here is what Mac D stands for, which is moving average convergence divergence. Sure, this definitely sounds like a mouthful, and it may seem quite complicated, but in in all reality it’s actually quite a simple indicator. Now all that the MACD indicator actually does is measure the relationship of exponential moving averages.
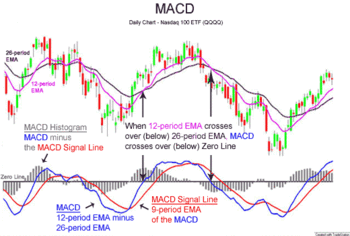
In other words, if you attach this indicated to a chart, and you take a look at it, you will see that it displays three different lines. It displays the MACD line, which is a blue line, a signal line, which is a red line, and a histogram, which is a green line. The main point of this particular indicator is to illustrate the difference between the signal lines and the MACD lines.
If we were to put this in technical terms, it means that the MACD indicator is the difference between two moving averages that have been exponentially leveled. These are generally leveled on 12 day and 26 day periods. The signal line usually takes the form of a nine day. Exponentially smoothed average of the moving average convergence divergence line.
What is also important to note here is that the NACD indicator also functions somewhat like an oscillator because it provides you with both overbought and oversold signals, which appear either above or below the zero lines. The MACD line usually wavers around about the zero line.
The Information that the Moving Average Convergence Divergence Indicator Tells You
Of course, one of the most important things that you need to know about this particular technical analysis indicator is what it can actually tell you. So the MACD indicator is absolutely one of the most versatile and useful day trading indicators out there. And the main reason for this is because it has the ability to provide you with two different types of information.
Therefore, what you first need to know here is the fact that there are four different types of indicators that are used in day trading. The four different types of indicators are trend, momentum, volume and volatility indicators. Now, for the most part, indicators usually only provide you with one of these types of information, but the MACD indicator is different because it actually provides you with two types of information.
This particular technical analysis indicated provides you with both trend and momentum information, which therefore makes it extremely useful. The fact that it is both momentum and a trend indicator makes it hands down one of the best technical analysis tools out there. Let’s provide you with a basic rundown of exactly what the MACD tells you when it looks a certain way.
- When the MACD line crosses above the zero line, it means that the signals are in an uptrend and this usually means that traders will take it as an indication to place a buy trades.
- When the MACD line crosses below the Zero line, that indicates that the signals are in a downtrend and this usually means that traders will take it as an indication to place sell trades.
Pros & Cons of Moving Average Convergence Divergence
OK, so as is the case with any good technical analysis indicator out there, the simple reality is that the MACD does have advantages and a couple of disadvantages that you need to know about. So let’s take a quick look at the pros and cons of this technical analysis indicator.
Pros
- Perhaps the best thing about this particular technical analysis tool is the fact that it is both a trend indicator and a momentum indicator.
- What’s also really cool is that for increased clarity and accuracy, you can use the MACD indicator along with other trading tools and indicators.
- If you use the MACD crossover and the divergence, this is an indicator that can provide you with extremely clear and accurate buy and sell signals.
Cons
- When it comes to signal reversals that NACD indicator may provide you with false signals. Sideways movements or pauses and trends may look like reversals when they’re actually not.
- The simple fact of the matter is that this indicator doesn’t always provide you with 100% accurate information about trends. Trend following signals may sometimes fail, and moreover, sometimes these signals may not move enough before a trend reversal occurs.

How to Calculate MACD
Let’s provide you with a quick rundown of exactly how to calculate the MACD.
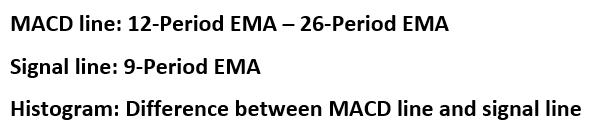
- First, calculate the 12 period EMA for the price at a chosen time.
- Calculate the 26 period EMA for the price at a chosen time,
- Subtract the 26 period EMA from the 12 period EMA.
- Based on the result obtained in step 3, calculate a 9 period EMA.
What’s the Best MACD Setting for Day Trading
Although the MACD is usually set to 12, 26, and 9, most would agree that the best settings for day trading are 5, 13, and 1, or if you need the highest degree of sensitivity, then 5, 35, and 5 works well too.
Final Thoughts on the MACD Indicator
The bottom line here is that if you want to become a day trading pro, then you do need to master using the moving average convergence divergence indicator.
If you need help day trading, and what you need is a comprehensive education, particularly on Forex trading, then the best place to be is the Income Mentor Box Day Trading Academy. At this time, the IMB Academy is the most comprehensive, user friendly, effective, and affordable Forex trading school out there.
CLICK BELOW TO JOIN INCOME MENTOR BOX AND START MAKING REAL PROFITS!
![]()