Simple vs Exponential Moving Average
If you are planning on trading forex, cryptocurrencies, the stock market, or anything in between, then one thing that you need to know all about are indicators. Specifically, today we are here to talk about a very certain type of trend indicator. Of course, trend indicators tell you all about the trend or direction of the price of a specific security or asset. With that being said, one of the most important trend indicators out there is the moving average.
Now, moving averages are a very important component of technical analysis, and this is true whether you are trading Forex, the stock market or anything in between. When it comes to trend indicators, the moving averages are some of the best out there, and they can provide you with a whole lot of information that can help you trade with ease. Now, if you have no idea what moving averages are, no worries because this is what we are here to explain today.
Now, not only are we going to explain what exactly moving averages in trading are and what they can do, but we will also compare the two main types. Yes, there is more than one kind of moving average out there. Specifically, today we are going to talk about a simple moving averages and exponential moving averages. They are both very useful tools for trading or specifically their technical analysis indicators that provide you with vital information. With that being said, the simple and exponential moving average are two different things, and you need to know exactly what they can do for your trading game.
What are Moving Averages?
OK, so before we can get to comparing simple and exponential moving averages, it’s probably a good idea to get a basic definition of what exactly are moving average is. So first and foremost, a moving average is a very specific type of technical analysis indicator that is used in a variety of markets including cryptocurrencies, Forex, the stock market, the commodity market and more. Of course, the moving average is one of four different types of indicators.
The four different types of indicators are there are trend, volume, volatility and momentum indicators, and yes, the moving average is a trend indicator. To put this in simplest terms, a moving average helps you as a trader keep track of price trends for specific assets or securities. In other words, it tells you in which direction the value of an asset is trending, so you can then place, buy or sell signals as needed. Moreover, a moving average can also provide you with a little bit of information in regards to the momentum of a trend.
For instance, if there is an uptrend in a moving average, it could also signify an increase in the price or the momentum of a security. Going in the other direction, if there is a downtrend in the moving average, it could signify a decrease in the price or momentum of the security. Moving averages are all about letting you know in which direction of price is moving so that you can then decide whether to place buy or sell signals. Let’s move on and compare the simple moving average to the exponential moving average.
The Simple Moving Average
So First off, we have the simple moving average, which as you can probably tell by the name of it, is the much simpler of the two types of moving averages. You provide you with a very basic definition that simple moving average or SMA calculates the average price within a selected time period or time range. To put this in simplest terms, it takes a specific amount of closing prices at the end of the day of a specific security or asset and then divided by the number of periods or days within that range.
In other words, if you were trying to find the simple moving average for the last 10 days, you would add together the closing price of the last 10 days and then divide that number by 10. This would be your SMA.
Now, just in case you are wondering, the simple moving average is a specific type of technical indicator that tells you in which direction the price of an asset is moving, as well as if it will continue to rise or. If it is going to reverse. Moreover, this can provide you with very valuable information in terms of whether a bold market or a bear market is on the horizon. This might be a very simple indicator, but it is also a very effective one that all sorts of traders can use to determine when and where the best times to trade are.
Pros & Cons
Now what you do need to know about the simple moving average is the fact that there are both benefits to it and drawbacks. Now, when it comes to the benefits of this type of moving average, the biggest one is that it provides you with a very smooth line that’s not prone to whip sawing back and forth due to small highs and lows.
In other words, this type of indicator does not respond to very temporary and slight price swings, thus providing you with a good deal of stability. For this reason, this type of moving average is best used for longer periods of times and time frames.
With all of that being said, the simple moving average does have some drawbacks. With the primary one being that it is extremely slow to respond to rapid price changes, especially when market reversal points occur. Due to the fact that that simple moving average is very slow to respond, it doesn’t work all that well for the short time frames.
Calculating the SMA
What is nice about the SMAD is the fact that it is extremely easy to calculate. For instance, if you are working over a five day. You would simply add up the values of the closing prices of the last five days of that specific security and then divided by 5. Take a look at the very simple example that we have provided you with below for a good idea of exactly how to calculate this type of moving average.
$8+$9+10+11+12 = $50
$50/5 = 10
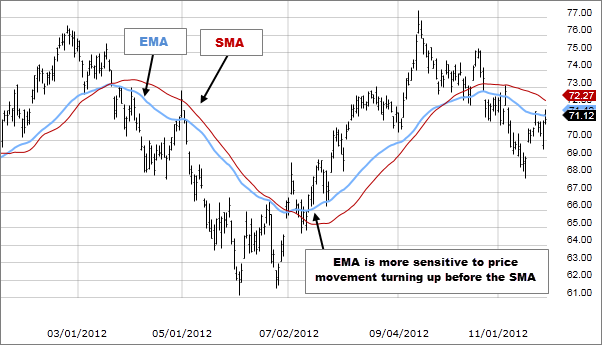
The Exponential Moving Average
The second type of the moving averages that we want to talk about now is the exponential moving average. Now, as you can probably tell by the name, this is the more complicated of the two main types of moving averages. The EMA is yet another type of technical chart indicator that helps to track the price of a stock commodity, a currency pair, or anything else of the sort over a specific period of time. Just like the simple moving average, the EMA also indicates in which direction a trend or price is moving to a certain degree. It can also provide you with information about the momentum of an specific trend. Yes, in this sense it is just like the SMA.
However, with that being said, there is of course a big difference, and it is that the exponential moving average is the type of weighted moving average or WMA. This is WMA because the EMHS Place is the most important or weight on the most recent price used in the calculation or in other words, the price value taken from the most recent day is the one that has the most meaning in this equation.
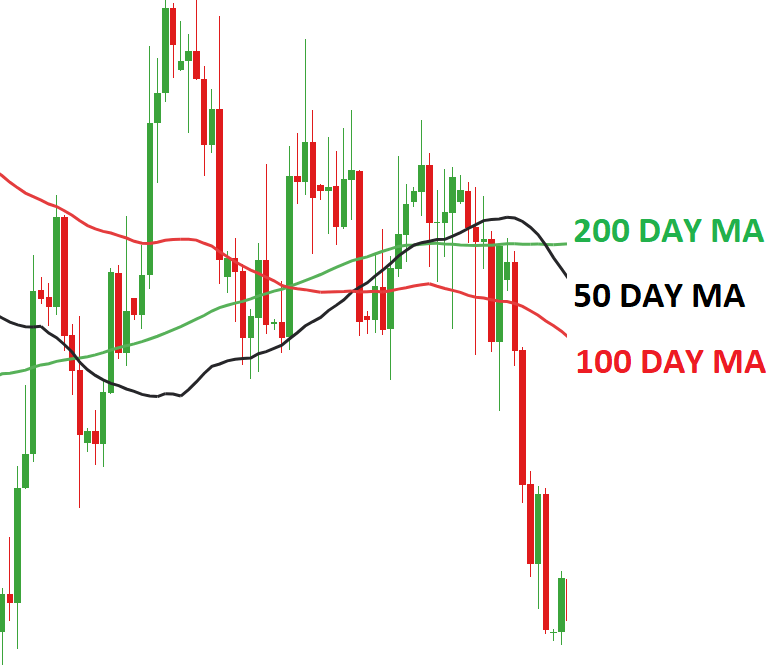
Due to the fact that the exponential moving average places the most weight or importance on most recent prices, it is therefore best used for short time frames as it reacts very well to sudden price changes. Due to this, it tends to be a lot more accurate for shorter periods of time than the simple moving average. With that being said, if you do want to trade longer time frames with the MA, you can still use it for 50 days, 100 days and 200 day time periods. But with that being said, the best time periods to use for the MA include both the 12 day and the 26 day periods.
/EMA-5c535d5a46e0fb000181fa56.png)
Pros & Cons
Of course, just like the simple moving average, the EMA does also have its advantages and drawbacks. For instance, when it comes to the benefits, the fact that it responds very quickly to slight and recent price changes is extremely useful when it comes to short term trading. Moreover, the exponential moving average is also ideal for calculating short term trends and short term trend reversals.
With that being said, the big downfall of the EMA is the fact that it is quite vulnerable to producing false signals, and it tends to whipsaw back and forth due to slight price changes due to this fact, it is not one of the best types of moving averages to go with for long term trading.
Calculating the EMA
- To calculate the EMA, you first need to obtain the SMA for a specific period of time. For instance, if you have a 20 day time period, you need to calculate the SMA for that period, and then, on the 21st day, you can use the SMA of the previous 20 days as the first EMA for yesterday.
- You must then also calculate the weighting or the smoothing factor for the EMA, which is [2 / (number of observations) +1], which in this case would be [2/(20+1)] = 0.0952.
- The final step of the calculation of the EMA is EMA = closing price x multiplier + EMA of previous day x (1 – multiplier). Yes, this is of course a bit complicated, but with just a little bit of practice, you should be able to master this calculation with relative ease. Just go to some price charts and give it a shot.
As you can see, calculating the exponential moving average is not all that easy, and to get it right it will take a good bit of practice. But with that being said, once you have done it a few times, you should have mastered it.
FAQs
We want to finish things off by answering all of your most important questions about moving averages. So let’s get to it.
-
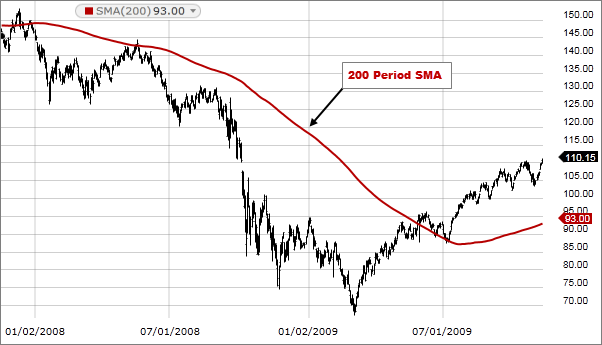
Why is the 200 EMA important?
The 200 DMA is considered to be one of the most important Indicators for long term trends and can be very easily applied to any security. If you want to identify reversals in trends, then this is what you need to use.
-
What is the 20 EMA?
The 20 day MA or exponential moving average tends to be the best one to use for daily charts because the price follows it very accurately during a trend. For instance, if the price is above the 20 line, it is generally a bullish trend, whereas if the price is below the 20 line, it is usually a bearish trend.
-
What is the Best EMA for Day Trading?
If you plan on trading the short term, then the best EMAs to use are both the eight day and the 20 day EMAs. However, for long term investors. You want to use the 50 day and the 200 days EMAs.
-
What is the 21 Day EMA?
What is important to note here is that the 21 day EMA places 9% of importance on the most recent price. By comparison, at the 100 day EMA places only 1.9% weight on the most recent price. Therefore, if you plan on identifying short term trends, then the 21 day EMA is a great moving average to use.
-
Which EMA is Best for Forex Trading?
The 5, 10, 12, 20, 26, 50, 100, and 200 day time frames are all considered ideal for Forex trading.
The Bottom Line on Moving Averages
When all has been said and done, the bottom line here is that you do absolutely need to know about moving averages in order to be a successful trader. If you plan on engaging in lots of technical analysis and you want to pay attention to trend indicators, than the simple moving average and the exponential moving average are both great ones to keep an eye on.
If you are looking for a comprehensive day trading education, and what you want is the very best Forex trading school around, then the Income Mentor Box Day Trading Academy is something worth checking out.
CLICK BELOW TO JOIN INCOME MENTOR BOX AND START MAKING REAL PROFITS!
![]()