Price Action Trading Basics
If you are planning to become a profitable trader, something you should become intimately familiar with is price action. Price action actually forms the basis of all technical analysis, whether it be for a stock, a commodity, or for a Forex currency pair.
There are many short-term traders out there who rely almost exclusively on PA, the trends, and formations extrapolated from it to enter and exit trades.
Indeed, this is one of the fundamentals of technical analysis which technical traders to use to make trading decisions. Right now, we want to introduce you to price action trading basics, a good little crash course to get you started.
What is Price Action?
To get you started, it is probably ideal if you have a definition of what price action is. Specifically defined, PA is the movement of a security’s price that is plotted over a certain period of time. Indeed, price action forms the base of all technical analysis across a wide range of markets.
This analysis is performed in respect to price changes that happened in the recent past. In simplest terms, price action is a specific technique for trading that allows traders to analyze a market and make subjective trading decisions based on both the recent and actual movement of prices.
Although PA does incorporate technical analysis, and while technical analysis is a large part of this trading style, it is not the only part of it. Something to keep in mind is that this style of trading does largely ignore fundamental analysis factors.
What Does Price Action Tell You?
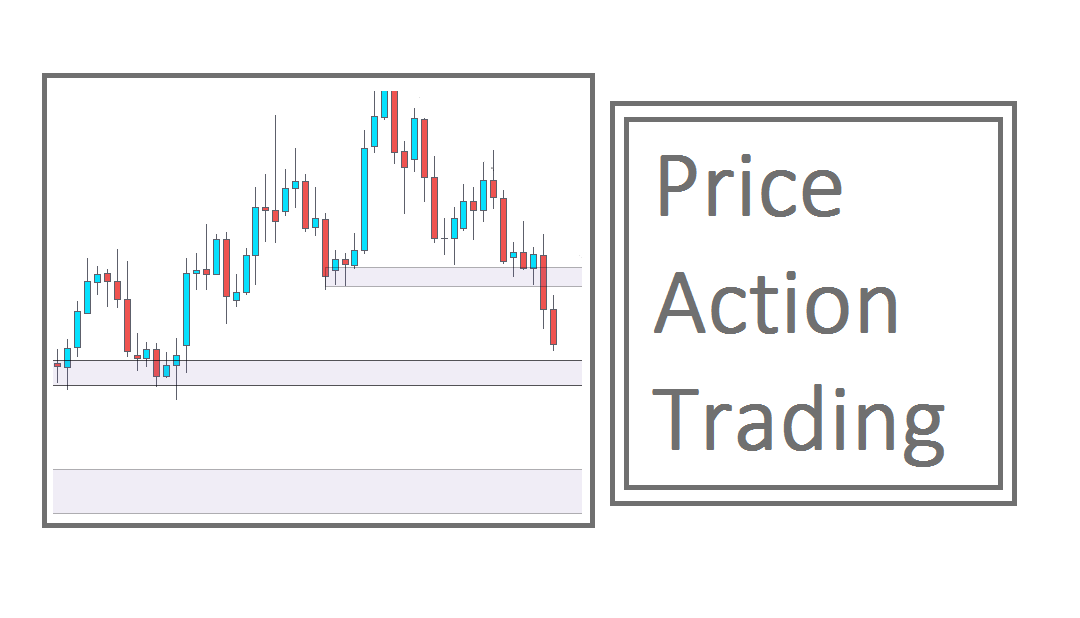
Price action is something that can be seen and interpreted by using charts that plot prices over a certain amount of time. Traders use price action and corresponding charts to identify and interpret trends, breakouts, and reversals.
Many traders will use candlestick charts to determine PA. Many traders also use the data gleamed from price action in order to calculate the figures for technical indicators. As you can see, PA is a very important aspect of technical analysis, one which can inform you of various market factors that will influence your trading.
Who Uses PA for Trading?
The cool thing about this type of trading is that because it can easily identify trends, breakouts, and reversals, it can be used by a variety of traders and for many purposes. Retail traders, speculators, arbitrageurs, and many other types of traders use PA in their trade setups.
Moreover, this sort of trading can be used for equities, stocks, bonds, commodities, derivatives, Forex, and more. It’s a really useful concept to be familiar with, one that can help make you a much better trader.

Benefits of Price Action Trading
You might be wondering why you would use PA in your trading setups. Well, there are actually quite a few benefits that you might not be aware of. Here are the benefits that are most often associated with PA trading.
- The first and biggest benefit that you get here is that this sort of trading is very simple. The fact of the matter is that purely technical traders use charts and overload their screens with myriad of technical indicators, oscillators, and so much more. Sure, this might be fine for an experienced professional, but for a beginner, this can be extremely overwhelming. Price action trading is very simple and ideal for beginners.
- Yet another benefit of PA trading is that the signals which it produces are very easy to detect. You don’t need to hold a Master’s degree in finance to engage in this type of trading. All you have to know are the basics of PA, and you should be able to easily detect trading signals for your setup.
- Something else that stands out here is that it is easy to use long timeframes for PA trading. Simply put, the longer the timeframe you use, the more data you have to work with, and the more accurate the signals end up being. It’s a perfect way to trade for people who like using longer timeframes.
Limitations of PA Trading
One of the only limitations that you will see in price action trading is that interpreting the data provided to you is subjective. Some traders might read the data one way, and other traders might interpret it in the opposite way. The most important thing to keep in mind here is that predictions for trading are based largely on speculation, which is of course subjective. Even trades with high probabilities are still speculative.
How to Use PA for Trading
What is also important to note is that price action is not really soon as a tool, not like an indicator, but instead, it is seen as a source of data upon which indicators and trading strategies are built. Trend traders and swing traders are those most likely to work closely with PA, as they ignore fundamental analysis in favor of focusing on support and resistance levels.
The Tools Used in Price Action Trading
The other thing you might be wondering is what kind of tools you need in order to engage in price action trading. Well, PA relates to the past price and recent historical data on price movement, and therefore, all sorts of tools and indicators are used in this sort of trading.
Charts, trend lines, price bands, high and low swings, technical levels of support and resistance, are all tools use here.
All sorts of indicators which analyze trends, momentum, volatility, and volume can be used here. To finish it off, PA can be seen as a highly systematic trading methodology that is aided by recent price history and a plethora of technical analysis tools.
Price Action Basics – Final Thoughts
The bottom line is that price action trading comes in very handy for newbie traders, as it is quite easy to master and often results in very reliable signals. If you want to learn more about it, the Income Mentor Box Academy is here to help.
CLICK BELOW TO JOIN INCOME MENTOR BOX AND START MAKING REAL PROFITS!
