An Introduction to Candlestick Patterns
When it comes to trading Forex and other markets, something that you should be familiar with are candlestick patterns. Candlestick charts and the patterns which they create are an integral part of technical analysis for many traders. These charts display price movements over a given period of time, thus allowing traders to identify trends and trend reversals.
There are many patterns that may occur in these charts, but before you can get to analyzing the dozens of possible patterns, you first need to know how to read these charts. Today, we want to take you on an introductory course on candlestick patterns, what they are, what they show you, and how to interpret them too.

What are Candlestick Patterns Charts?
Candlestick charts originated in the country of Japan over 100 years ago, when a Japanese man named Homma discovered that while there was a link between the price of rice and its supply and demand, markets were also strongly dictated by the emotions of traders.
Candlesticks show that trading emotion by representing the size of price movements with varying colors. Trader then use these candlestick patterns to make trading decisions, which are based on regular patterns that help to forecast short term price direction.
In essence, a candlestick chart is a chart comprised of individual candles, and these are used in order to understand price action. The whole point of using candlestick patterns is to pinpoint where the price opened for a certain period, where it closed for a certain period, as well as what the highs and lows in a certain period are.
Price action is a valuable factor of trading because it can inform traders of both trends and trend reversals. Candlestick charts can also form patterns which inform traders of the best entry and exit points for their positions. One of the most popular timeframes for these candlestick patterns is the daily chart, which helps to identify the daily high, low, close, and open.

Benefits of Candlestick Patterns Charts
You might be wondering why you would use candlestick patterns. Well, many technical traders rely on these patterns for 3 main reasons.
- Candlestick patterns allow traders to determine the state of the market by looking at the color and length of the candlestick. Traders can instantly determine whether a market is strengthening or weakening.
- Using these charts, traders an determine the direction of the market by analyzing the color and shape of the candlestick.
- These patterns also allow traders to quickly identify market patterns by displaying specific bullish and bearish trends that other charts do not display.

The 3 Components of a Candlestick
Something that is also important for you to know is that candlesticks have 3 main components. These are as follows.
The Body
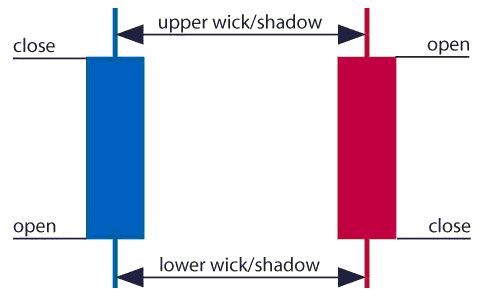
The body or main part of the candle is the difference between the open and close. This is the colored portion of the candlestick.
The Upper Shadow/Wick
This is the vertical line in between the high of the day and the open (bullish candle) or the close (bearish candle).
The Lower Shadow/Wick
This is the vertical line between the low of the day and the open or close.
Interpreting a Candle
Now that you know what the various components of candlesticks are, you need to know how to interpret all of the different shapes, colors, and more. Here we have a detailed guide on how to interpret a candle and what each one means.
Open Price
The open price shows the first price traded during the formation of a new candle. If the price begins to trend in an upward direction, the candle will turn green or blue (the colors will differ depending on the settings chosen for your chart). If the price begins to trend downwards, the candle will turn red.
Close Price
The close price shows the last price traded during the formation of a candle. If the closing price is below the open price, the candle will turn red by default. If the closing price is above the opening price, the candle will turn green or blue, depending on chart settings.
High Price
The top of the candle, the upper wick, displays the highest price which something was traded at during the given period. If there is no upper wick or shadow, it means that the open price or the close price was the highest price traded in that time period.
Low Price
The bottom of the candle, the lower wick or lower shadow, displays the lowest price at which something was traded at during the given time period. If there is no lower wick or shadow, then the lowest price is the same as the open price or close price in a bullish candle.
The Wick
Keep in mind that the wick of the candle is also referred to as its shadow. The wicks are very important because the display price extremes in a given time period. The wicks are much thinner than the bodies of the candles, thus making them easy to identify, and they make the strength of the candlestick patterns apparent.
The Range
Another important aspect of candlestick patterns to be familiar with is that the difference between the highest price and the lowest price of a candle is its range. You can figure out the range by subtracting the lowest point of the candle from the highest point. This makes it easy to identify trends and price patterns.
The Direction
The direction in which a price is moving is indicated by the color of the candlestick. If the price of a candle is closing above the opening price of the candle, it means that the price is moving up, and therefore the candle would be green. However, if the candle is red, it means that the price closed below the open.
An Intro to Candlestick Patterns Charts – Final Thoughts
The bottom line is that you definitely need to be familiar with candlestick patterns and candlestick patterns charts. They are an integral part of Forex, stock, and commodities trading that you need to master in order to become a truly profitable trader.
CLICK BELOW TO JOIN INCOME MENTOR BOX AND START MAKING REAL PROFITS!
