Support & Resistance Trading For Beginners
OFFICIAL SITE: INCOMEMENTORBOX.COM
When it comes to technical analysis, whether in Forex or any other type of day trading, support and resistance are two of the most important terms you will ever come across. Now, support and resistance trading, although it might sound simple and straightforward, it actually comes in a variety of forms, and is harder to master than one might think.
LEARN TO DRAW SUPPORT & RESISTANCE BY USING FIBONACCI:
Sure, you might know that S&P has to do with reading charts and identifying price barriers which prevent the price of asset from moving in a certain direction. However, there’s a lot more to it than that. Today we’re here to give you a little crash course on support and resistance trading for beginners, just so you can get familiar with the concept and its basic tenets.
Support & Resistance – A Basic Definition
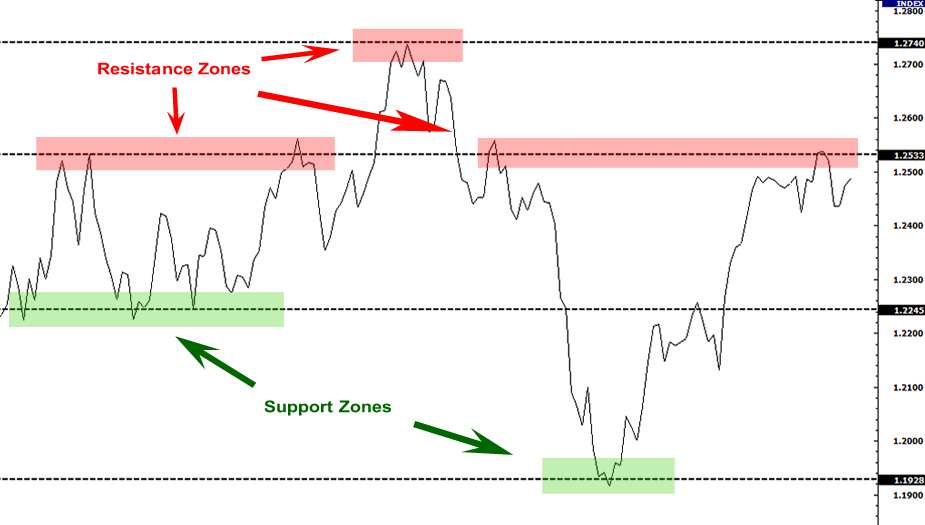
So, before you can really understand how support and resistance trading works, you need to know what both support and resistance are, so let’s provide you with some simple definitions of each. First off, you have support, which is characterized by a price level where a downward trend is expected to pause due to a high level of demand. As the price of the asset, security, or whatever else drops, demand for that same asset increases, this creating a support line.

Next you have your resistance zones. Resistance zones are created due to the increased selling off of an asset when prices increase. Yes, both are closely related, and in layman’s terms, a resistance line shows you when the upward momentum of an asset is going to pause, and a support line indicates the pausing of the downward momentum of an asset.
The important part to note about these support and resistance lines is that they then help you to identify valuable entry and exit points when looking to make a trade. This is done by recognizing S&P lines, and also knowing that a price can do one of two things when it hits either of those lines. A price may bounce back in the other direction, away from the line, or it may violate that price level and continue on until it hits the next support and resistance level.
One of the key takeaways for you to know here is that support and resistance trading usually always follows the belief that these lines or levels will not be broken. Now, prices may violate support and resistance lines and keep on moving, but for the average trader, this is usually not too serious, as trades going in the wrong direction can quickly be closed, hopefully with only a small loss.
Support & Resistance Price Levels
So, here we just want to hammer home exactly what S&P levels are, with a small example so you can really get the hang of it all. Bob is our fictional trader, just so you know.
Resistance
So, if Bob notices that the price of an asset never goes over $50, and that the price of an asset has risen to $50, or very close to it, several times in a certain time period, that $50 price level would be known as resistance. A resistance level can also be seen as a ceiling, something which prevents the price from being pushed any higher. Once the price reaches $50, it can be assumed that the price will then bounce back or decrease, so Bob would probably be inclined to make a sell trade.
Support
You then have support, which is the opposite of resistance. Say if an asset never dips below $5 in value and has been shown to bounce back upwards from that $5 level several times in a certain time period, this would be support. Support is kind of like a floor, something which stops a price from dipping below that certain level. So, once the price hits that $5 support line, Bob would be inclined to make a buy trade.
Support & Resistance – Trend Lines
One concept or facet of support and resistance trading which you need to be very familiar with if you plan on using this form of technical analysis for day trading is the trend line. What we have talked about so far is of course S&P, but we have only talked about static support and resistance levels. This is a popular and much used form of S&P trading, but what you need to know is that the price of any kind of asset, whether in Forex, a stock, a security, or anything else, tends to increase or decrease over time.
In other words, assets have price trends, and it could be an upward trend or a downward trend. The important takeaway from this is that support and resistance levels don’t always stay the same, but instead, they follow trend lines or price trends. If you were to visualize it, instead of a support or resistance line being totally flat and horizontal, it is often diagonal, whether upwards or downwards. This is why you also need to understand what trend lines are in order to effectively and profitably trade this way.
Using Trend Lines
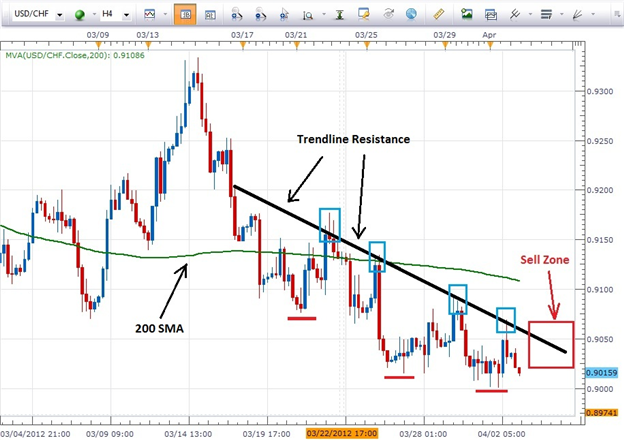
Now, when a market asset is trending upwards, resistance levels will form as price action slows and starts to pull back towards the trend line. This is generally a result of other traders taking their profits or due to uncertainty about the price. This then results in a plateau or price peak, which is then followed by a small drop off in price, or in other words, it’s a short term top. Most traders keep a close eye on the price of asset as it falls towards the broader support of a trendline, as this is usually where a price is prevented from moving further in that same direction, or in other words, from going much lower.
There’s also the other side of the equation, where the market is trending downwards, and here traders will watch for declining peaks, and will then connect these peaks using a trendline. When the price approaches the created trendline, most traders will watch for when the asset encounters selling pressure, which may be a basis for entering a short position, as this is an area that has historically pushed the price down. The bottom line here is that day traders will use these S&P trendlines to identify levels where prices rarely move beyond, whether upwards or downwards. It’s a great way to find entry and exit points for trades.
Support & Resistance Trading – The Issue of Round Numbers
On a small side note, something that does often come into play when it comes to support and resistance trading is the issue of the round number. Often, the price of any asset has a hard time moving past a value, a round number in this case, something like $100.
The reason for this is because many newbie traders tend to buy or sell assets when the value of them is at a nice, round, and whole number, such as $100 for example. Take profit and stop loss levels are usually set at round numbers. Now, because there tend to be so many stop or target limits set at these whole numbers, they then form their own strong price barriers, their own levels of support and resistance.
Support & Resistance, Moving Averages, & Other Indicators
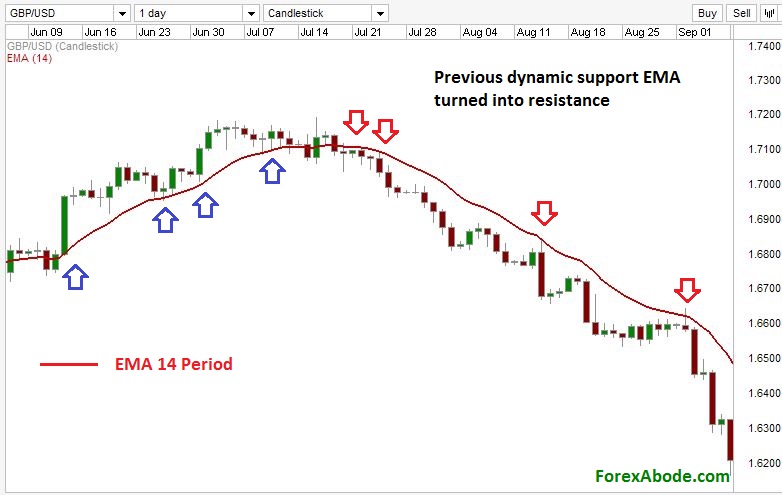
Something that you also need to know here is that moving averages do come into play for S&P trading. Moving average can be used in many ways for this kind of trading. For example, a moving average can be used to identify the upward movement of an asset, to identify when price levels cross a key moving average line, or to exit a trade when the price falls below a moving average.
For the most part, moving averages will automatically create support and resistance lines, that can then be used to place trades. Keep in mind that you may need to alter the time period of the chart you are looking at, so you can look at moving averages across various time periods to find the one which works best for your personal style of support and resistance trading.
Now, when it comes to the technical analysis side of things in trading, there are many different indicators that can be used to identify these price barriers. However, remember that no matter the indicator or method of analysis used, the support and resistance lines you end up with should always look similar no matter the road you took to get there. One of the favorite indicators to use to identify S&P levels is the Fibonacci retracement tool, as it easily identifies reliable S&P lines.
Support & Resistance – The Significance of Zones
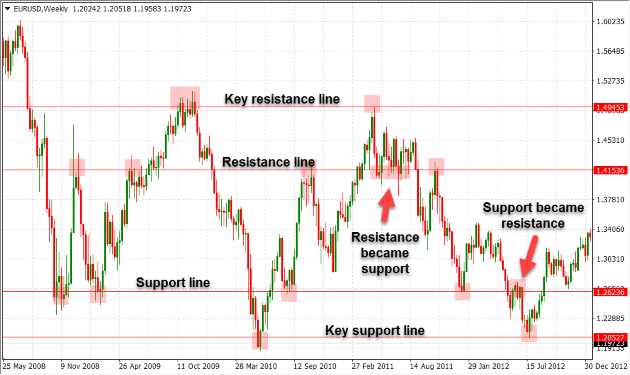
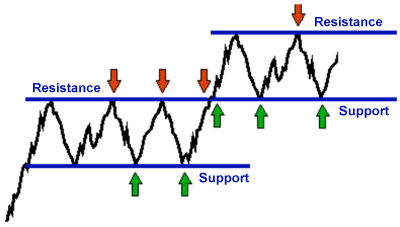
The final thing we want to talk about today is how to measure the significance of zones in support and resistance trading. As we talked about earlier, support lines are like floors and resistance lines are like ceilings. Now, imagine something like a ball bouncing off the floor (support), and then off the ceiling (resistance), and going back and forth between the two. It’s like an asset going through price consolidation between those S&P zones.
Something to be aware of here is that support and resistance zones can be broken. Just imagine that this bouncing ball gains a ton of momentum, whether bullish or bearish, due to added pressure from buyers or sellers, and then passes through the support or resistance levels. Another important point to note here is that a support level often becomes a resistance level over time when the price wants to move back up, and this can happen in the other direction as well, with a resistance level becoming a support level as the price falls. To identify specific zones of S&P, there are a number of things which traders will look at.
The Preceding Price Movement
One of the most important factors has to do with various preceding price movements. For instance, support and resistance zones will usually become more significant when they are preceded by big advances or declines in price. As an example, a very steep uptrend is going to be met with more competition, and may then be halted by a much more significant resistance level that an uptrend that is slow and steady. This may be because a slow and steady upward advance does not attract as much attention from potential investors and traders.
Number of Touches
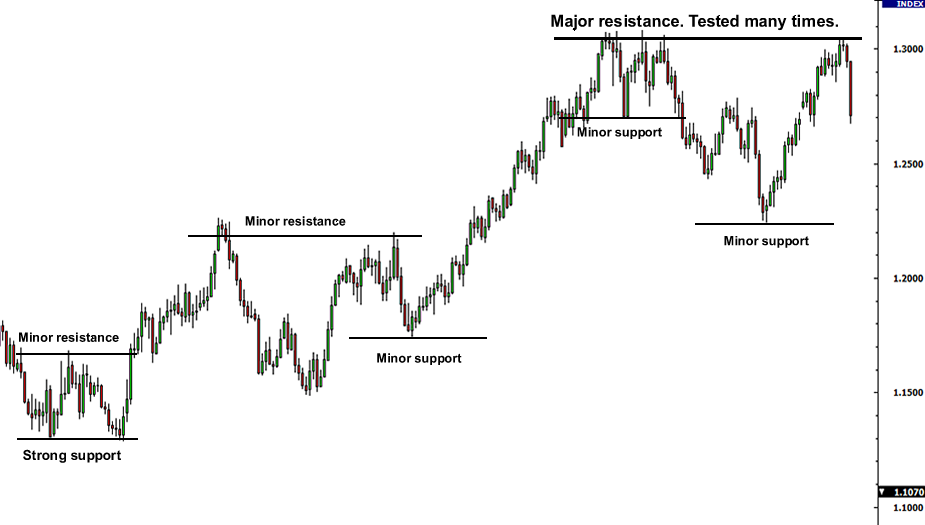
Something else that helps traders identify support and resistance zones is by the number of times an asset’s price touches a support or resistance area. The more times a price touches either of those, the more significant that zone or level becomes. The more a price bounces off a certain support or resistance level, the more influential it becomes, and the more traders will base their trading decisions off those specific zones.
Time
Another point of note here is that S&P zones often become more significant if those levels have been tested over time, regularly tested over an extended period.
Volume & Price Levels
The other way which traders identify these zones is by looking at the volume of an asset being traded at a certain price level. The more buying or selling that has happened at a certain price level, the stronger the support and resistance is going to be. More than anything, it’s because traders will remember certain price levels, and are then more likely to trade at those particular levels in the future.
For instance, when a lot of activity happens at a high volume and the price falls, a strong selloff is likely to occur when the price returns to that same level, which is because people are more likely to close a trade with the aim of breaking even, rather than closing at a loss.
Support & Resistance Trading – Final Thoughts
When it comes to support and resistance trading, it’s one of the most important concepts used in technical analysis. This is also something which forms a basis for many other tools to be used in combination with one another. You need to know what support levels are, what resistance levels are, using trendlines to identify changing support and resistance levels, and so much more.
No, it’s not particularly easy, but it is one of the very best ways to identify the best entry and exit points for trade. Now, this was just a little crash course, but if you really want to learn everything there is to know about S&P trading, joining the Income Mentor Box Day Trading Academy is highly recommended.
CLICK BELOW TO JOIN INCOME MENTOR BOX AND START MAKING REAL PROFITS!
